All-Inclusive Price Index 2026: Historical Resort Price Snapshot
Explore our August 2026 editorial price snapshot: 253 stored resort rates, with 25 destinations ranked. Historical figures are not current booking quotes.
By All-Inclusive Guide Editorial Team
Research & Editorial Desk · June 2026 · Updated October 2026 · How we review
On this page
This is a historical editorial price snapshot, not a live all-inclusive price comparison. The August 2026 version of our resort reviews stored 253 numeric starting-price values. Recomputing those fields gives a $268 median and a mean of about $329.
The destination ranking below uses the 25 destinations with at least three stored prices: 248 resorts. Five other priced resorts in three smaller destination samples are included in the global figures but excluded from the destination ranking.
Prices/rates change with season and availability — confirm the current rate and exactly what’s included before you book. The original fields do not prove matching stay dates, occupancy, rooms or board plans. They are not comparable offers for two people sharing or a prediction of what you can book today.
18 October 2026: calculations reproduced from the August repository snapshot. This verifies the historical arithmetic, not the underlying resort quotes or their availability.
The headline findings
- The stored sample had a $268/night median (median across 253 resorts) — multiplying by seven gives $1,876, without establishing occupancy or a bookable weekly total. The mean is higher, at $329, reflecting values at the upper end of this stored sample.
- Tunisia had the lowest destination median in the sample at a $90 median — its lowest stored value was $65/night; current availability is unverified.
- The Maldives had the highest destination median in the sample at a $713 median, nearly 8× the price of Tunisia when comparing those historical medians; the stays were not standardized.
- The stored destination medians differ. Antigua and Barbados had $600 medians, compared with Turkey ($222) and Spain ($205) — without controlling for room, date or package differences.
- Five-star-labeled entries had a median about 61% above four-star entries ($300 vs $186 median); this is a comparison of stored fields, not equivalent packages.
- 47% of stored values were $200–400/night. 30% come in under $200, and 23% sit above $400.
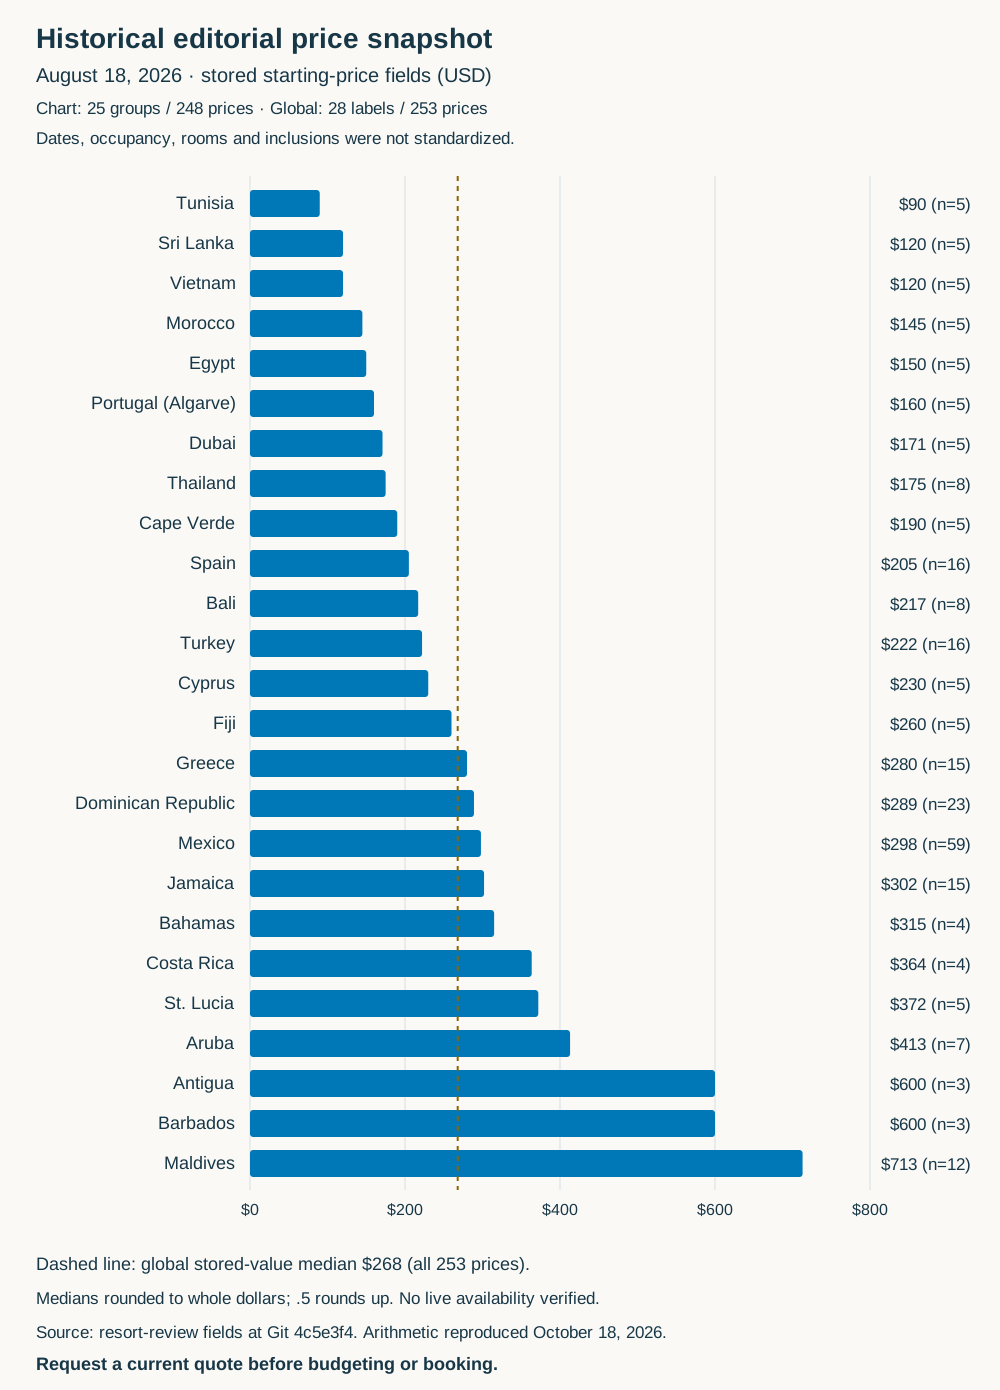
Destination Medians in the Historical Sample
Historical median of stored editorial starting prices, lowest to highest. These are not standardized double-occupancy quotes. Click a destination for the guide and obtain a new quote for your trip.
| # | Destination | Median / night | Stored range | Resorts |
|---|---|---|---|---|
| 1 | Tunisia | $90 | $65–$140 | 5 |
| 2 | Vietnam | $120 | $70–$280 | 5 |
| 3 | Sri Lanka | $120 | $90–$160 | 5 |
| 4 | Morocco | $145 | $115–$240 | 5 |
| 5 | Egypt | $150 | $125–$250 | 5 |
| 6 | Portugal (Algarve) | $160 | $120–$230 | 5 |
| 7 | Dubai | $171 | $122–$286 | 5 |
| 8 | Thailand | $175 | $130–$250 | 8 |
| 9 | Cape Verde | $190 | $180–$200 | 5 |
| 10 | Spain | $205 | $100–$550 | 16 |
| 11 | Bali | $217 | $125–$450 | 8 |
| 12 | Turkey | $222 | $135–$917 | 16 |
| 13 | Cyprus | $230 | $200–$260 | 5 |
| 14 | Fiji | $260 | $220–$480 | 5 |
| 15 | Greece | $280 | $184–$480 | 15 |
| 16 | Dominican Republic | $289 | $125–$600 | 23 |
| 17 | Mexico | $298 | $95–$800 | 59 |
| 18 | Jamaica | $302 | $177–$600 | 15 |
| 19 | Bahamas | $315 | $217–$588 | 4 |
| 20 | Costa Rica | $364 | $202–$400 | 4 |
| 21 | St. Lucia | $372 | $345–$664 | 5 |
| 22 | Aruba | $413 | $310–$700 | 7 |
| 23 | Barbados | $600 | $550–$700 | 3 |
| 24 | Antigua | $600 | $500–$750 | 3 |
| 25 | Maldives | $713 | $374–$3,622 | 12 |
Destination labels with fewer than three numeric stored prices (Hawaii, Turks & Caicos, St. Vincent) are excluded from the ranking. Medians are rounded to whole dollars, with .5 rounded up. Stored August 2026 review-field snapshot; arithmetic reproduced October 2026. See methodology below.
Destination Differences in the Historical Sample
The lower destination medians were concentrated in North Africa and parts of Asia, while several Caribbean destinations and the Maldives had higher stored values. This describes this sample’s editorial coverage; it does not establish what comparable accommodation or all-inclusive entitlements cost in those destinations today.
Five Lower-Median Destinations
- Tunisia — $90 median, five stored resort values.
- Vietnam — $120 median, five stored resort values.
- Sri Lanka — $120 median, five stored resort values.
- Morocco — $145 median, five stored resort values.
- Egypt — $150 median, five stored resort values.
Use these as destinations to investigate, then obtain current quotes for matching dates, room and party size. A historical minimum is not a price guarantee.
Higher Stored Prices in the Historical Sample
The following entries had higher starting-price fields in the August snapshot. Their rooms, packages and destination settings differ; current availability is not verified here:
| Resort | Destination | From / night |
|---|---|---|
| Kudadoo Maldives Private Island | Maldives | $3,622 |
| Pullman Maldives All-Inclusive Resort | Maldives | $1,266 |
| Hotel Wailea, Relais & Châteaux (historical field) | Hawaii | $950 |
| Maxx Royal Kemer Resort | Turkey | $917 |
| Lily Beach Resort & Spa | Maldives | $900 |
| Sandals Saint Vincent and the Grenadines | St. Vincent | $818 |
| Club Med Kani | Maldives | $816 |
| Grand Velas Los Cabos | Mexico | $800 |
| Hammock Cove Resort & Spa | Antigua | $750 |
| Constance Moofushi | Maldives | $750 |
Five of these ten entries are in the Maldives. The table does not establish the most expensive bookable resorts in the world or verify their all-inclusive status. For example, Hotel Wailea’s current FAQ explicitly says it is not all-inclusive; its historical price field must not be treated as an all-inclusive quote.
Rating Labels in the Stored Sample
The historical fields labeled five-star had a $300/night median; the four-star entries had a $186 median, about 61% more for the five-star-labeled group. These labels were not independently rerated for this calculation, and the prices do not control for dates or package terms.
These example entries were labeled five-star and had stored prices below the four-star median of $186. Across the full sample, 40 five-star-labeled entries had stored values below $200:
| Resort (5★) | Destination | From / night |
|---|---|---|
| Iberostar Selection Royal El Mansour | Tunisia | $65 |
| Iberostar Selection Diar El Andalous | Tunisia | $70 |
| Steigenberger Marhaba Thalasso | Tunisia | $90 |
| Mövenpick Resort & Marine Spa Sousse | Tunisia | $110 |
| Vinpearl Resort & Spa Phu Quoc | Vietnam | $110 |
| Vinpearl Resort & Spa Nha Trang Bay | Vietnam | $120 |
| Cinnamon Bey Beruwala | Sri Lanka | $120 |
| Pickalbatros White Beach Taghazout | Morocco | $125 |
| Steigenberger Coraya Beach | Egypt | $125 |
A rating label does not establish that two resorts have comparable facilities, service or package coverage. Check the rating source and the inclusions that matter to you before paying more for a star category.
How to Use the Snapshot
Use the destination table to decide where to request current quotes. Compare the same dates, room, occupancy and board plan; add flights, baggage, transfers and compulsory charges. A star label, historical low rate or old destination median does not establish the best value for your trip.
Methodology
We reproduced the figures from the resort-review files at Git revision 4c5e3f4, dated August 18, 2026. There were 253 numeric priceFrom values across 28 destination labels. The global median was $268 and the mean $328.85 (rounded to $329). The destination table includes 25 labels with at least three values, a subset of 248 priced resorts.
The fields are editorial starting-price records, not a retained set of matching checkout quotes. The calculation cannot establish a common stay date, room category, occupancy, all-inclusive entitlement or tax treatment. Reproducing a value from a review does not independently validate its original source. The sample follows our editorial coverage rather than a representative selection of the market.
The five-star and four-star groups use the rating fields stored in the same snapshot. The $200–400 band contains 118 of 253 values, about 47%. Do not interpret a group median as an offer for every resort in that destination or rating category.
Cite this study
When referencing this historical editorial snapshot, state its August 2026 vintage and the limitations above. Please credit All-Inclusive Guide with a link to this page (https://all-inclusive-guide.com/guides/all-inclusive-price-index-2026/). Journalists and editors wanting the underlying per-destination breakdown or a custom cut of the data are welcome to get in touch.
Frequently Asked Questions
What is the average cost of an all-inclusive resort in 2026?
This historical snapshot contains 253 editorial priceFrom values stored in our resort reviews in August 2026. Their median was $268 and their mean approximately $329. These are not current quotes or a representative market average, and the stored fields do not establish identical dates, occupancy, room or package terms. Confirm a new quote before budgeting.
What is the cheapest all-inclusive destination?
Tunisia had the lowest destination median in the historical sample, at $90 across five stored resort values. That does not establish that it is currently the cheapest destination, or that those prices are available for your dates and party.
What is the most expensive all-inclusive destination?
The Maldives had the highest destination median in the historical sample, at $713 across 12 stored resort values. Resort types and package terms differ, so this is not a like-for-like destination comparison or a current booking forecast.
Is a 5-star all-inclusive worth the extra money?
The historical fields labeled five-star had a $300 median versus $186 for four-star, a difference of about 61%. Ratings and prices in this sample do not establish a comparable quality difference or a guarantee of value for a new booking.
How much should I budget for a week at an all-inclusive resort?
Obtain a current total for your dates, party, room and board, then add flights, baggage, transfers and compulsory charges. Multiplying an old headline rate by seven is only arithmetic; it does not establish a bookable weekly budget.
How was the All-Inclusive Price Index compiled?
The calculations use 253 numeric priceFrom fields from the August 2026 Git snapshot of our resort reviews. There were 28 destination labels; the ranking includes 25 with at least three stored prices, covering 248 resorts. Reproducing the arithmetic does not verify the original live quotes or prove common occupancy, room and inclusion terms. These are historical editorial data, not a current market survey.
Get the next guide before Google does
One email every two weeks: our newest resort reviews, one genuinely good deal, and honest calls on which resorts are slipping. No daily blasts.